
iOS Application Security Part 17 – Black-Box Assessment of iOS Applications using INTROSPY
In this article, we will look at how we can use Introspy for Black-box assessment of iOS applications. Introspy is developed by ISEC partners and its github page can be found here. Introspy consists of two seperate modules, a tracer and an analyzer. It is undoubtedly one of the most powerful tools for analyzing the security of iOS applications.
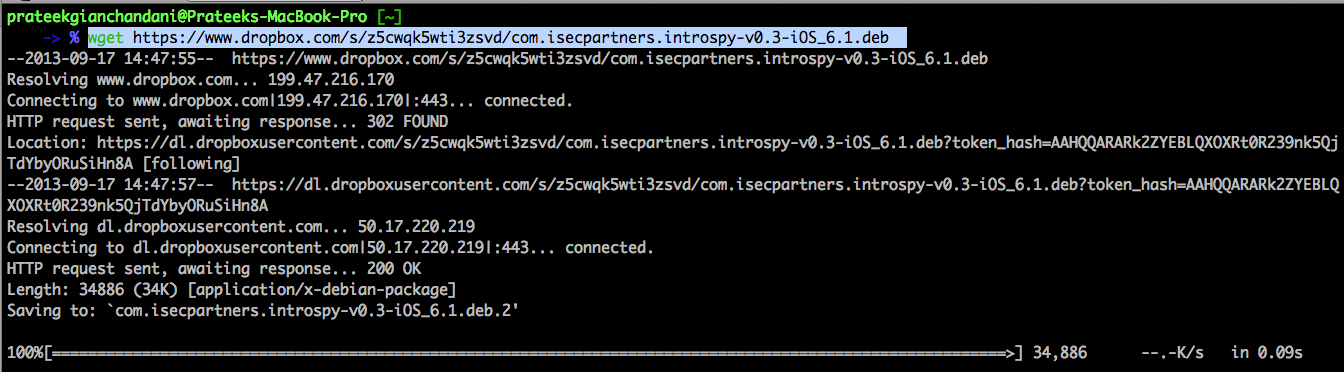
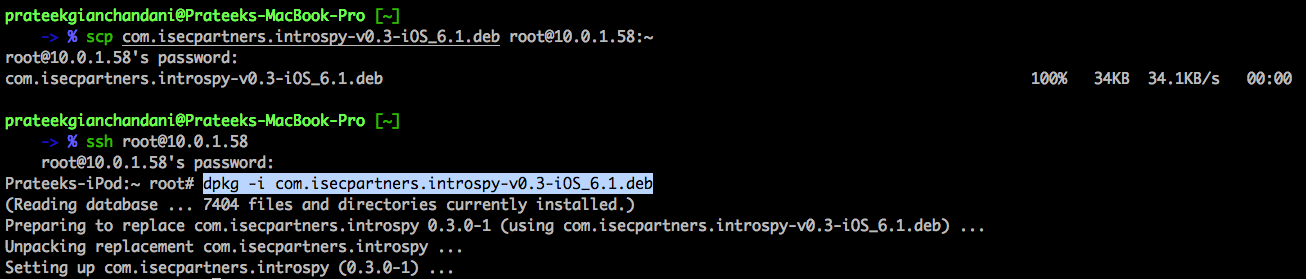
The first step is to install the Introspy tracer on your device. You can download the debian package from here. Once it is downloaded, just upload it and install on your device. The image below shows how to perform all the above mentioned steps.
Once the tracer has been installed on your device, reboot or respring it. Go to Settings app and you will now see a different section for Introspy.

The Introspy Apps section lets you choose the apps that you want to perform your analysis on. So go over to it and select the app that you want to analyze. In my case, i will select the Path app for analysis.

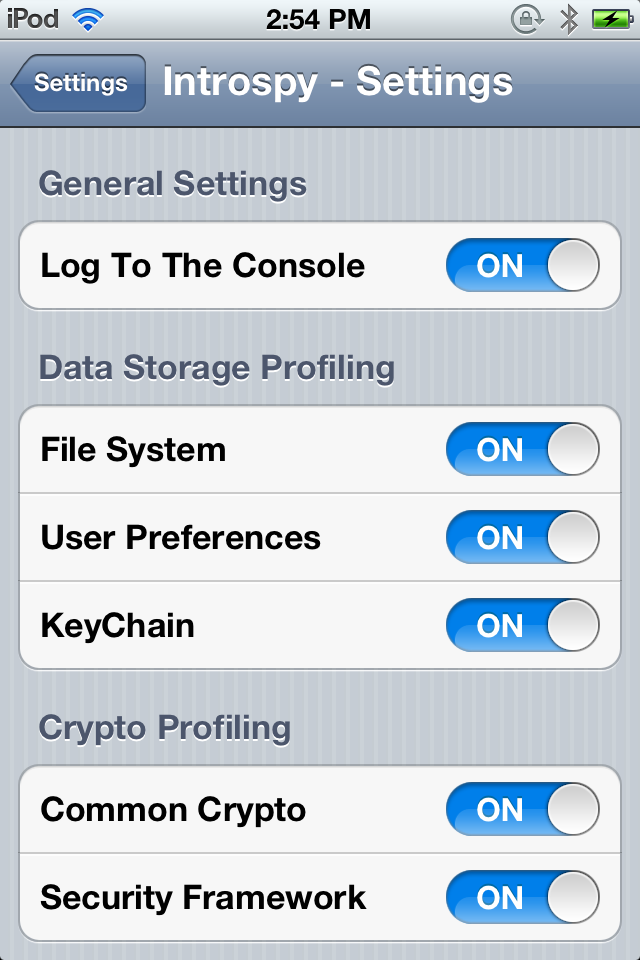
Now go over to the Introspy settings option and make sure every option is selected, specially the option Log to The Console. If we check this option, the Introspy analyzer will log all the information that it finds about the app to the device console which allows us to see the information being logged during runtime.
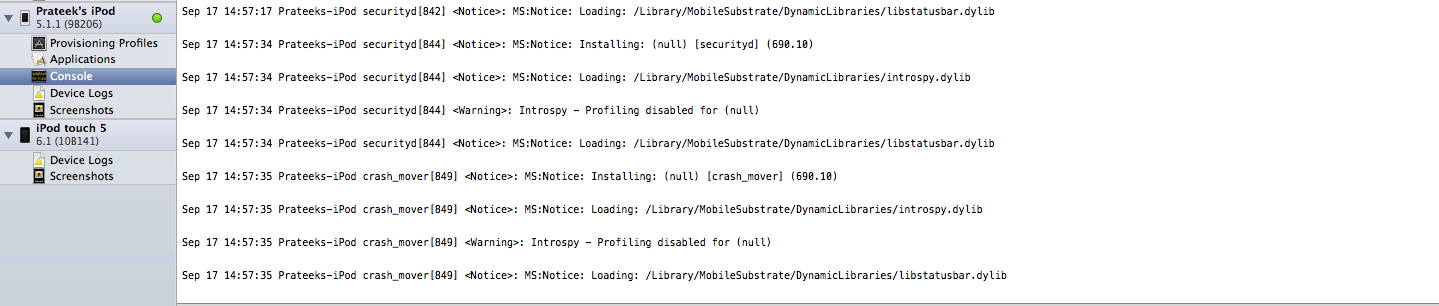
Once the Path app has been selected, make sure it is not running. If it is running, quit it and restart the app again. Also make sure that your device is connected to your computer as we want to see the device logs that the Introspy analyzer will be logging. Also, open Xcode on your machine (if you are on a Mac), go to Window -> Organizer -> Devices. Choose your device from the menu on the left and select Console. You will now be able to see the device logs.
Now start the Path app and try to browse the app as much as possible. In the meantime, the analyzer will work in the background and collect as much information about the app as possible. You can see that it is logging info on the device as well. In this case, we can see a request being made to the server and we can see all the contents of the request, including the path and the query parameter.

And over here, you can see that the app is checking the NSUserDefaults for the userId key. This information should have been stored in the keychain instead.

But probably the most interesting piece of information can be found from the image below. As you can see, the app is checking NSUserDefaults for a bool value HangTracerEnabled. This could have been a check to see if the the app is being traced during runtime and if so, quit the app. However, this technique seems to fail currently as it not able to detect the Introspy analyzer. But when i ran Snoop-it to analyze the Path application, it crashed. So this bool value definitely seems to be a check to determine whether tracing is being enabled or not. We will look up this concept in later articles.

Apart from displaying the runtime information about the app in the Console, Introspy also saves it in a sqlite database file on your device. From your computer, you can fetch this database file and Introspy will convert it into a well presentable format. To fetch the database files from your device, first of all download Introspy from its github page. Then navigate inside the Analyzer folder and use the command as shown in the figure below. You will need to specify the directory in which the report will be put on your local machine as well as the ip address of your device.

As you can see, Introspy will ask you to select a database file. These database files are created for each application that we had selected from the Settings. In this case, lets select the database for the Path App.

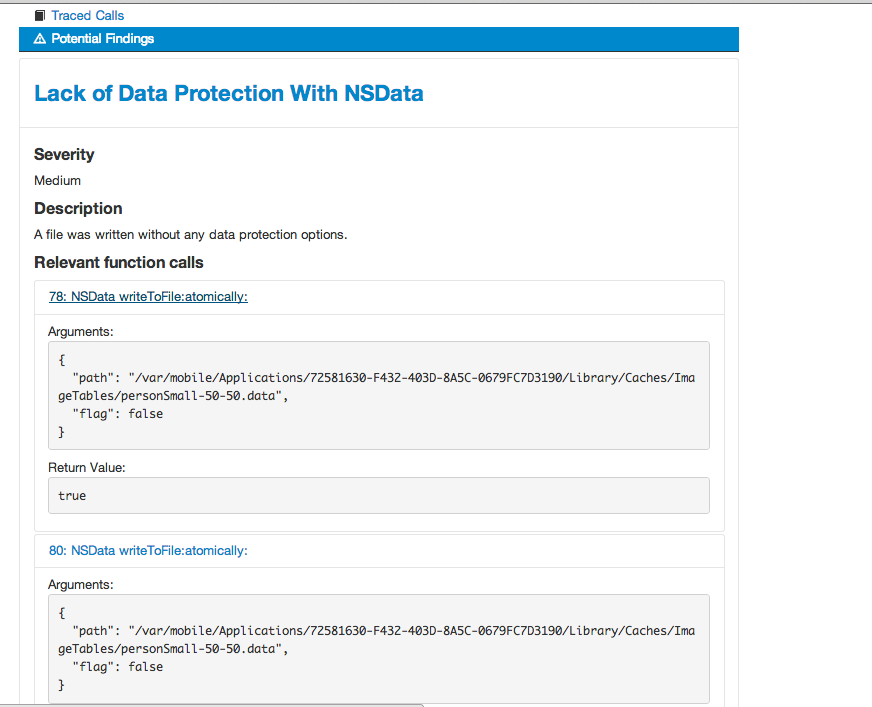
You will see that the database file had been saved in the present directory as well as a folder with the name Path-Report had been created. If we go inside that folder and open up the file report.html, this is what we see. As you can see, Introspy has displayed the complete information in a much more presentable format. We can see the list of traced calls along with the arguments that were passed.

We can also see a list of potential findings. These are basically the vulnerabilities that Introspy thinks it has found out. In this case, we can see some Insecure Data Storage issues. Its not necessarily a vulnerability though as the information that was written may not have been of much importance.
You can also customise the information that you want to see by selecting the options as shown in the image below.
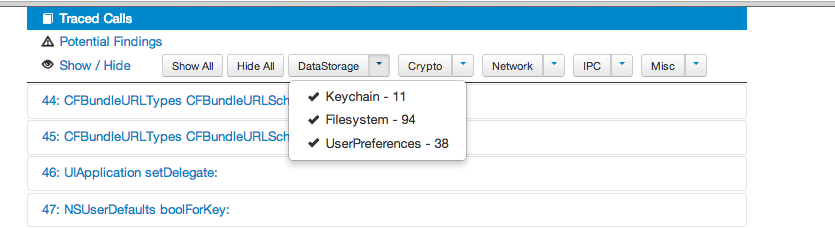
For example, i have configured it to just show me the methods related to UserPreferences. This information can be very helpful as it can help us find some important information that may have been written to NSUserDefaults. Even though it is not shown in the image below, but i was easily able to figure out that Path was saving my userId in NSUserDefaults and using it in a lot of other places. This information should have been stored in a more secure place, for e.g the keychain.

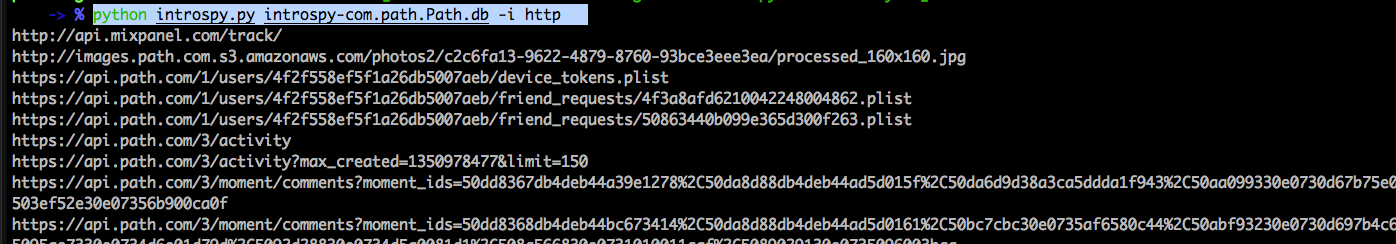
We can also analyze the saved database file directly from the command line. Here is the usage information.

Let’s use the info command on http. As you can see, it dumps a list of the endpoints.
Introspy can also be imported as a module and used in other Python scripts. We can also add our own signatures to flag vulnerabilities or insecure configurations. We will look into those concepts in later articles.
Conclusion
In this article, we looked at how we can use Introspy to perform black-box assessment of iOS applications. Introspy consists of 2 modules, the Tracer and the Analyzer. We can use the Tracer to perform runtime analysis of the application. The tracer can then store the results in a sqlite file which can be later used by the analyzer for analysis, or it can also just log all the data to the device console. The Analyzer can also generate a well detailed HTML report from the database file.
References